Resource efficiency and carbon footprint
Energy usage
Increasing industrialisation and urbanisation, increasing fossil fuel consumption, rising energy
costs and climate change are a concern for broader society and Murray & Roberts. Murray &
Roberts consumed approximately two million MW-h of energy from a variety of fuel sources,
with bituminous coal, diesel oil and electricity accounting for 81% of the Group’s energy
usage. The table below indicates the amount of energy used by the Group and the major
users.
| |
|
|
|
|
|
% of |
|
|
|
|
| |
Fuel source |
|
MW–h |
|
|
Total |
|
|
|
Major user – % |
| |
Bituminous coal |
|
686 786 |
|
|
34,1 |
|
|
|
Ocon Brick – 95 |
|
|
| |
Diesel oil |
|
657 918 |
|
|
32,7 |
|
|
|
Clough – 74 |
|
|
| |
Electricity |
|
288 819 |
|
|
14,3 |
|
|
|
CISCO – 56 |
|
|
| |
Heavy fuel oil |
|
275 869 |
|
|
13,7 |
|
|
|
Much Asphalt – 60 |
|
|
| |
Petrol |
|
56 693 |
|
|
2,8 |
|
|
|
Concor – 24 |
|
|
| |
LPG |
|
36 145 |
|
|
1,8 |
|
|
|
Technicrete – 85 |
|
|
| |
Natural gas |
|
7 882 |
|
|
0,4 |
|
|
|
Hall Longmore – 100 |
|
|
| |
Naphtha |
|
3 380 |
|
|
0,2 |
|
|
|
UCW – 100 |
|
|
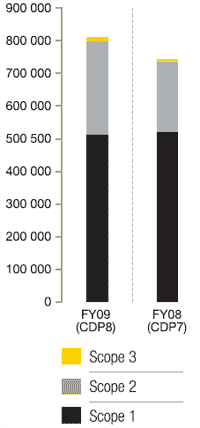
Carbon footprint
| Tonnes of CO2e |
|
|
 |
|
Murray & Roberts has participated in the
Carbon Disclosure Project (CDP) for the
past three years, to evaluate the impact its
activities might have on climate change. The
Group completed the CDP 8 (8th edition)
questionnaire in May 2010.
The Group’s carbon footprint reported last
year was 1 376 379 tonnes of carbon
dioxide equivalents (CO2e). This value has
been reviewed and corrected to 743 804
tonnes CO2e. The difference is due firstly to
the elimination of bitumen, which was
previously captured as an energy source
rather than as an additive to asphalt
production and secondly, carbon emissions
were recalculated with updated emission
factors.
The Group’s carbon footprint increased by
8,8% to 809 090 tonnes CO2e for the year
2009 (CDP 8). This increase is the result of
a significant improvement in monitoring and
reporting of carbon emissions across the
Group.
Approximately 79% of the Group’s carbon
footprint is attributable to its South African
operations with the Construction Products
SADC cluster accounting for 67% of the
total carbon footprint. Construction Products
SADC operations consume most of scope 1
(e.g. coal in Ocon Brick) and electricity
(scope 2). CISCO accounts for 56% of the
Group’s 288 million kilowatt hours of
electricity consumption.
The table below illustrates
the contribution to the footprint by
operational cluster. |
| |
|
|
FY 2009/CDP 8 |
|
|
|
|
|
|
|
|
|
|
|
|
|
| |
Operational cluster |
|
Scope 1 |
|
|
Scope 2 |
|
|
Scope 3 |
|
|
Total |
|
|
% Total |
|
| |
Construction Products SADC |
|
327 837 |
|
|
211 758 |
|
|
0 |
|
|
539 595 |
|
|
66,7 |
|
| |
Clough |
|
128 210 |
|
|
1 612 |
|
|
1 560 |
|
|
131 382 |
|
|
16,2 |
|
| |
Construction SADC |
|
17 911 |
|
|
34 901 |
|
|
24 |
|
|
52 836 |
|
|
6,5 |
|
| |
Engineering SADC |
|
24 433 |
|
|
14 846 |
|
|
0 |
|
|
39 279 |
|
|
4,9 |
|
| |
Cementation Group |
|
7 382 |
|
|
19 815 |
|
|
1 705 |
|
|
28 902 |
|
|
3,6 |
|
| |
Middle East |
|
7 931 |
|
|
1 252 |
|
|
246 |
|
|
9 429 |
|
|
1,2 |
|
| |
Corporate |
|
35 |
|
|
2 582 |
|
|
5 051 |
|
|
7 668 |
|
|
0,9 |
|
| |
TOTAL (tonnes CO2e) |
|
513 738 |
|
|
286 767 |
|
|
8 585 |
|
|
809 090 |
|
|
100 |
|
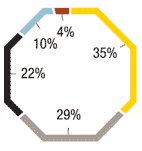
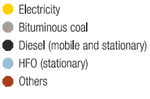
The figure below indicates percentage
contribution to the Group’s carbon footprint
by emission source. Electricity (scope 2
emission source), bituminous coal (scope 1),
diesel for mobile use (scope 1) and heavy
fuel oil (HFO) (scope 1) are the largest
contributors to the carbon foot.
Sources of greenhouse gas
emissions |
|
 |
 |
|
| |
|
 |
|
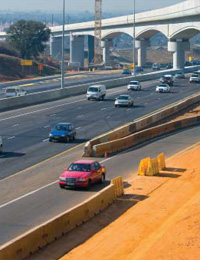
The Scope 3 emissions were restricted to employee travel. Scope 3 emissions for South
African operations were consolidated and reported under Corporate.
Murray & Roberts has identified the key climate change risks and opportunities, which are
summarised below.
| |
Category |
|
Risk and opportunity |
| |
Regulatory |
|
• |
Fuel/taxes and regulations |
| |
|
|
• |
Carbon taxes |
| |
|
|
• |
General environmental regulations, including planning (building codes and legislation) |
| |
Physical |
|
• |
Changes in precipitation patterns |
| |
|
|
• |
Changes in frequency of extreme weather events |
| |
|
|
• |
Induced changes in human, natural and cultural resources |
| |
Reputational |
|
• |
Litigation exposures, insurance costs and unforeseen environmental
remediation expenses resulting from the increasing number and
scope of regulatory requirements |
| |
Financial |
|
• |
Increased transportation costs: carbon tax and fuel levies will
increase transportation costs |
| |
Market |
|
• |
Trade and market risks of carbon intensive products (steel, asphalt,
clay bricks) compared to lower carbon alternatives |
| |
|
|
• |
Demand of low carbon solutions from clients |
| |
Others |
|
• |
Changes in the availability and costs of goods and services |
The implications for Murray & Roberts include:
- Increased expenses (purchasing emissions permits, penalties for over running caps,
reporting costs), increase in electricity costs and business running costs
- Increased rate of diseases, damage and disruption to operations near coastlines, increased logistics and insurance costs and availability of materials due to physical risks
- Revenue protection as well as the value of any existing assets in carbon intensive sectors,
new contract awards reduced by inability to offer these low carbon solutions/demands
by client
Murray & Roberts attempts to be proactive rather than reactive in terms of potential regulatory
risks. Possible changes in regulation are anticipated and actions are planned in advance of
regulatory changes. Furthermore, Murray & Roberts engages regulatory authorities to understand,
and potentially advise on impending changes. Potential physical risks from climate change are
constantly monitored at operational level and where they are material, they form part of each
company’s risk register.
Murray & Roberts launched an energy management initiative in early 2010 for all its South
African operating companies with the objective of:
- ensuring effective and efficient use of energy, and to reduce energy cost without
compromising productive output
- ensuring use of the most effective source of energy
- improving efficiency by reducing all sources of waste in energy, hence a reduction in carbon
footprint
It is too early to report on the impact of this initiative, but several initiatives are being
investigated.
The setting of green house gas (GHG) reduction targets for a large diversified company such
as Murray & Roberts requires understanding and the support of all of the companies and
operations involved. Murray & Roberts recognises that setting a group GHG target cannot be
done without interaction with all of the relevant companies. As such the company has started
a process of engaging those operations which contribute most to the overall group carbon
footprint to determine emission reduction actions, opportunities and possible targets. Details
of our actions to date are provided in our public response to the Carbon Disclosure Project
(www.cdproject.net).
CASE STUDY: GREENING ASPHALT PRODUCTION
|
Much Asphalt has introduced new technology to lower the carbon footprint and energy
use of asphalt production at its Benoni, South Africa plant. Much Asphalt introduced
double barrel green system technology which allows for temperature reductions of up to
30° celsius, thereby reducing energy and heavy fuel oil consumption, and the associated
carbon footprint. This technology reduces the carbon footprint of asphalt on an intensity
basis (kg CO2e/tonne of asphalt) of between 20% and 25%. Murray & Roberts will
continue to investigate the feasibility of retrofitting the existing Much Asphalt plants with
the new foam technology. This will allow the company to differentiate itself competitively
by offering a low carbon source of asphalt.
|
 |
Water usage
Murray & Roberts operates in several water constrained environments, including South Africa,
Western Australia and the UAE. Fresh water resources are dwindling, with 98% of South
Africa’s available water resources being fully utilised. The estimated water usage for the Group
was about 1,2 million kilolitres, mainly supplied by local municipal systems. Cementation
Group and our construction operations do not report on water used as it is accounted for on
site by clients. Murray & Roberts is, however, evaluating the possibility of participating in the CDP Water Disclosure project in an
effort to more accurately measure its water
footprint, better understand the water
related risks and opportunities and then
effectively manage water usage through
responsible water stewardship.
|


 Capabilities


